Why the Canadian Dollar Might Be Ready for a Comeback
As a currency trading novice, you might be under the impression that the Canadian dollar (CAD) has been struggling against the US dollar (USD) over the past few years. However, the current macro reality may challenge this assumption as several key factors suggest the CAD might be ready for a rebound. Let’s break down what’s happening in simple and comprehensible language.
Despite what you may have heard, Canada currently has the second-strongest economy among the G7 countries (which include the US, UK, France, Germany, Italy, and Japan). The Canadian economy grew by 1.3% over the past year, which might not sound like much, but it is impressive in the world of major economies!
Why Has the Canadian Dollar Been Weak Until Now?
The CAD has performed poorly against the USD for a few main reasons:
The US economy has been growing faster than Canada’s.
Recent trade tensions have created uncertainty.
Interest rate cuts by Canada’s central bank typically weaken the currency in the short term.
Three Simple Reasons Why Things Might Change
Interest Rates and Bonds are Shifting in Canada’s Favor
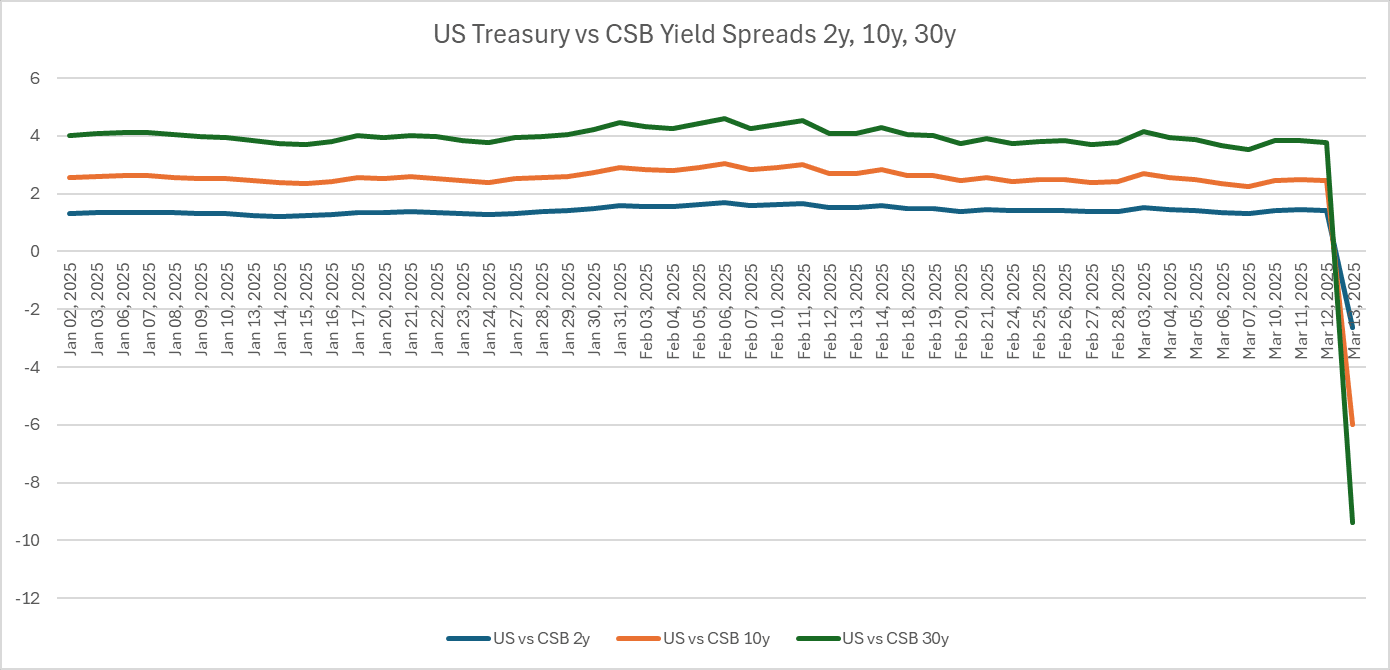
When you hear about “bond yields”, think of them as the interest rates governments pay investors who buy their debt. Higher yields usually attract more investors, which increases demand for that country’s currency.
What’s happening now: For the first time this year, Canadian government bonds are paying higher interest than US government bonds. As a result, investors might start buying more Canadian dollars to invest in these bonds.
Simple explanation: The lines crossing means Canadian bonds now pay better than US bonds
New Leadership Could Boost Confidence
Canada is expected to get a new Prime Minister – Mark Carney – who previously led the Bank of Canada and the Bank of England (two major central banks). He’s known for:
successfully guiding Canada through the 2008 global financial crisis as the head of the Bank of Canada.
being the first foreigner to lead the Bank of England’s monetary policy committee.
successfully leading the UK through Brexit and its subsequent adverse economic impact.
When countries have stable, experienced leadership with business-friendly policies, their currencies often benefit.
Technical Signs Point to a Potential Turnaround
Even if you don’t understand all the technical analysis terms, the simple version is this: the momentum pushing the US dollar up against the Canadian dollar is starting to slow down. This often happens before a currency changes direction.
What About Those Tariffs From the US?
Yes, the US has placed a 25% tax on most Canadian goods (and 10% on energy exports), which isn’t great for Canada. However:
Canada has placed its own tariffs on US goods in response.
Canada supplies critical energy resources that the US needs.
The new leadership plans to use this energy relationship as leverage in negotiations.
What This Means for New Traders
If you’re starting currency trading, the USD/CAD pair might be worth watching over the coming months. Here’s why:
Potential opportunity: Technical indicators suggest the USD/CAD might be ready to fall (meaning the Canadian dollar would strengthen).
Clear support level: Watch the price level of 1.41562—if the USD/CAD drops below this, it could confirm the downward trend.
Multiple supporting factors: When economic data, interest rates, and technical signals all point in the same direction, it often makes for a stronger trend.
Getting Started
If you’re interested in trading based on this outlook, BitDelta Pro offers:
Simple guides to help you understand currency pairs.
User-friendly tools for setting up trades with proper risk management.
Regular updates on how these economic factors are developing.
Remember that all trading involves risk, and currency movements depend on many factors that can change quickly. Start with small positions, use stop-losses to protect your investment, and never trade with money you can’t afford to lose.
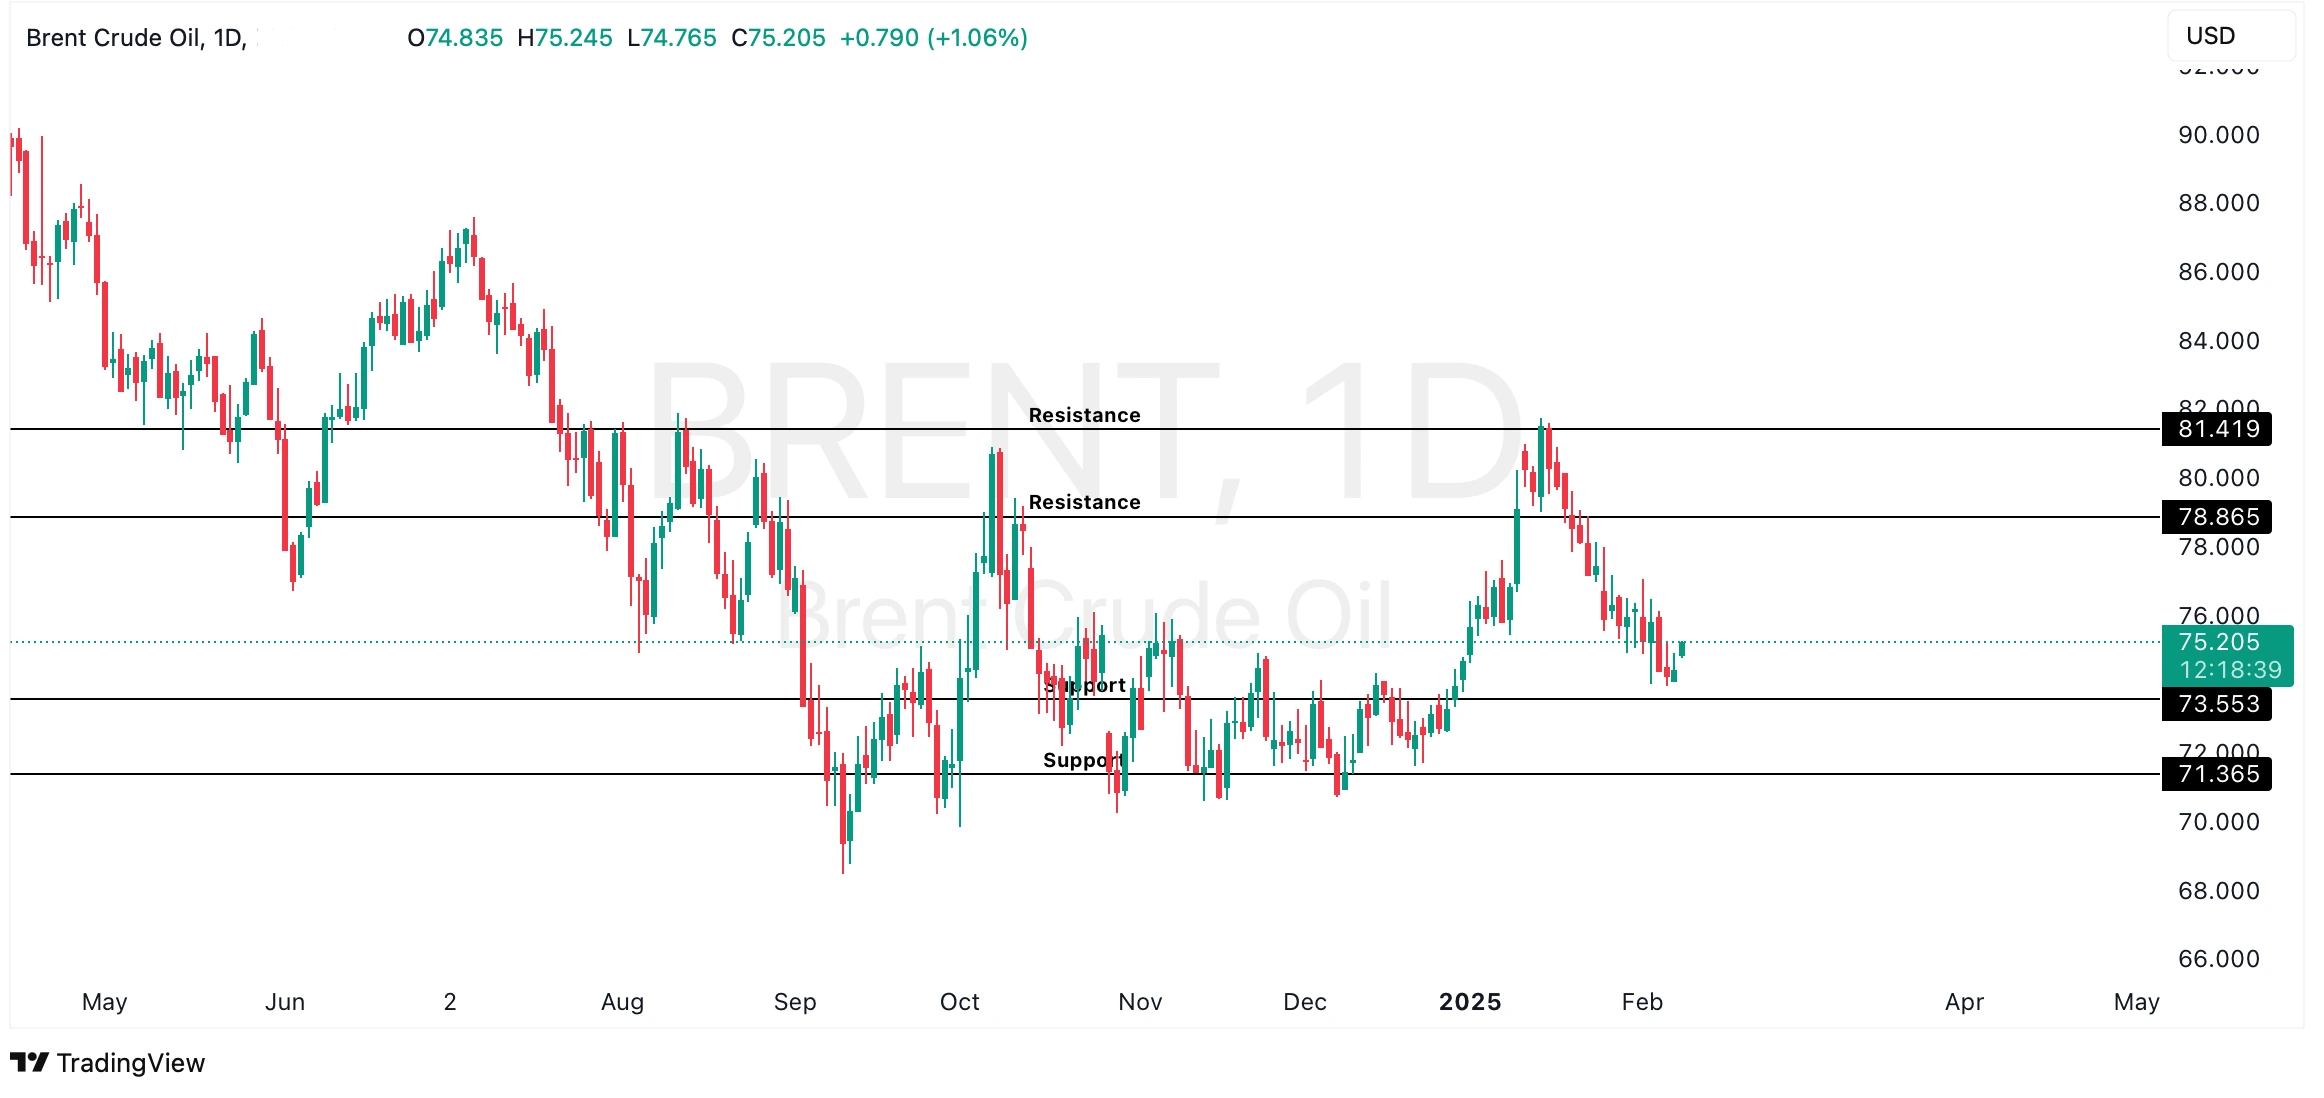
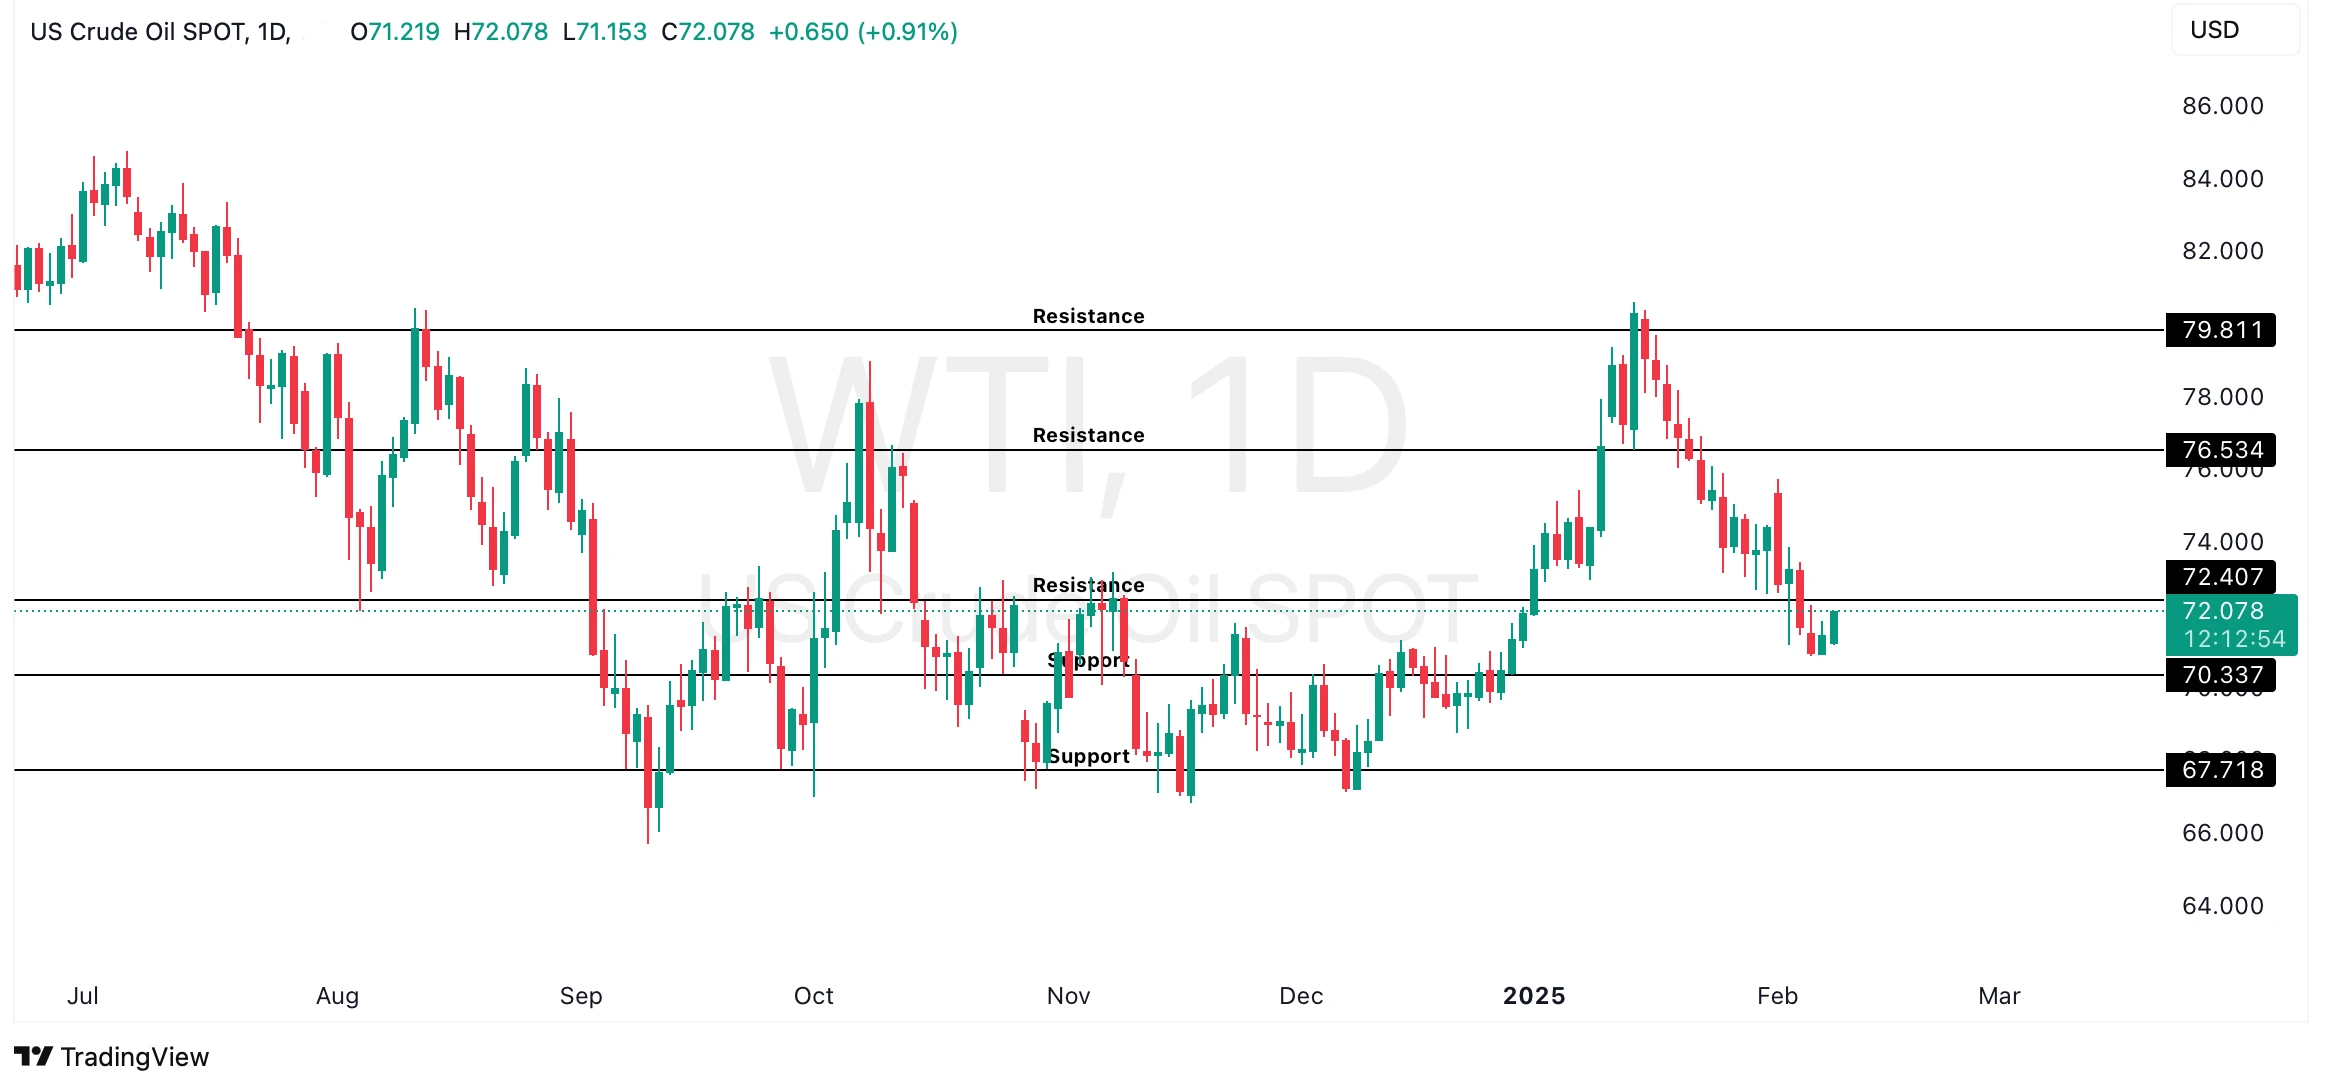
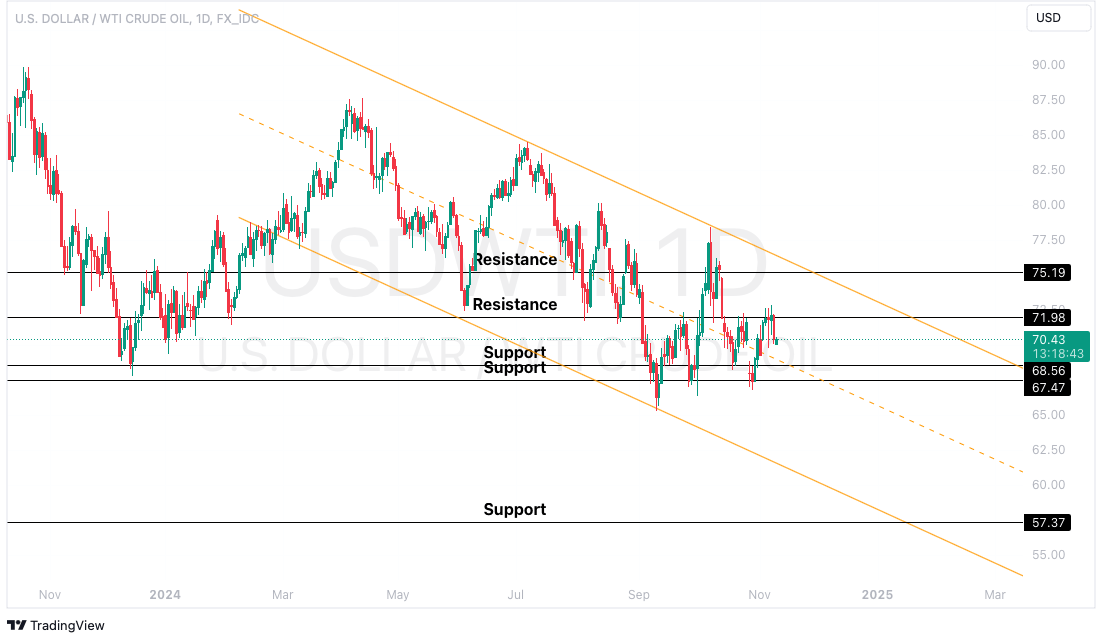
Crude oil prices remain volatile as global markets react to shifting geopolitical dynamics and evolving trade policies. WTI crude currently trades around $72 per barrel, while Brent crude holds above $75 per barrel. Market participants are treading cautiously, assessing how macroeconomic conditions, geopolitical risks, and trade disputes will shape future demand and supply dynamics.
The Russia-Ukraine Factor
A major catalyst in market sentiment is the potential peace plan between Russia and Ukraine, with reports suggesting an Easter ceasefire is under discussion. If negotiations progress, the easing of sanctions on Russian oil exports could inject additional supply into global markets. Russia’s willingness to engage in diplomatic talks introduces another layer of complexity, as any resolution could shift energy trade flows and influence pricing structures.
However, broader geopolitical uncertainty persists. Market participants are closely watching Western responses, particularly regarding future sanctions policies and energy security concerns. A partial lifting of restrictions on Russian crude could create short-term supply-side pressure, though the long-term impact will depend on how quickly European and Asian buyers reintegrate Russian oil into their supply chains.
China’s Strategic Countermeasures
Beyond geopolitics, US-China trade relations continue to shape the energy market. China has imposed a new 10% tariff on US crude oil imports and a 15% border tax on coal and LNG, effective today, February 10. This move is widely seen as a strategic countermeasure against broader US trade policies, reinforcing China’s push to diversify energy sources and reduce reliance on American crude.
Additionally, China has implemented export restrictions on 25 rare metals, escalating tensions beyond energy and into the technology supply chain. Given China’s position as a key crude importer, prolonged trade friction could alter global crude flows, forcing US producers to seek alternative buyers while strengthening Russia’s and the Middle East’s influence in China’s energy market.
America’s Moderate Oil Production
Despite political pressure to boost US oil output, supply-side realities show a more complex picture. US crude oil production is expanding at a measured pace, increasing by 300,000 barrels per day, but market indicators show no signs of accelerating drilling activity. This cautious approach from US producers reflects several key constraints:
Rising capital costs in a bearish price environment
Regulatory uncertainty affecting long-term investment decisions and export planning
This hesitation to increase production, despite administrative pressure, reflects a wider industry focus on profitability and operational efficiency rather than volume growth. The gap between political calls for higher output and market realities suggests US producers will likely maintain their disciplined approach unless more sustainable price support emerges.
Trade Policy and Economic Implications
Markets are also closely monitoring potential US trade policy shifts. President Donald Trump has signalled further action on “reciprocal trade” measures, which could introduce new tariffs affecting key trading partners. According to the Tax Foundation, such tariffs could:
Disrupt global supply chains, indirectly influencing oil demand
Shift economic growth trajectories, potentially reducing global oil consumption
As energy-intensive industries adjust to these policies, oil demand forecasts may undergo downward revisions, reinforcing concerns about long-term demand stability.
US Sanctions and Pressure on Iran
Another critical factor influencing oil markets is the ongoing US sanctions on Iran. Last week, the US administration ramped up its “maximum pressure on Iran” policy by announcing sanctions against an international network facilitating the shipment of Iranian crude to China. These measures also targeted individuals and tankers transporting Iranian oil.
While the US has focused on curbing Iranian exports, the geopolitical ramifications of such sanctions are far-reaching. Iran continues to seek alternative markets for its oil, with efforts to bypass sanctions and maintain its export capacity. As these sanctions restrict supply, they add volatility to the global energy market, particularly in the context of global oil demand uncertainties. Moreover, Iran’s influence on oil prices remains significant, with potential shifts in oil flows having broad implications for pricing, particularly in Asian markets where Iranian crude has been a key source.
Key Price Drivers in Focus
Several factors continue to shape crude oil price movements:
Ongoing US-China trade tensions and retaliatory measures
Potential adjustments to Russian oil sanctions amid peace discussions
Shifts in global energy supply chains and geopolitical alliances
The oil industry’s cautious approach to increasing output
Upcoming US economic data releases that could influence demand outlooks
The ongoing US sanctions on Iranian oil and its market impact
Technical Analysis
Oil prices are likely to face continued downward pressure unless significant new bullish catalysts emerge, particularly in a market environment characterised by heightened uncertainty from geopolitical factors and trade policy dynamics.
Source: TradingView | For Illustrative Purposes Only
GBP Outlook: Will the Bank of England Cut Rates or Hold Tight?
The British Pound GBP is in a tricky spot as investors and analysts debate whether the Bank of England (BoE) will begin cutting rates soon or keep them high for longer. With inflation still a concern and economic uncertainty lingering, markets are trying to predict the central bank’s next move.
Mixed Signals from the Bank of England
The BoE has been cautious about cutting interest rates, even as inflation has come down from its highs. The market is pricing in a 25-bps rate cut this Thursday, despite the central bank’s concern as this could make life more expensive for businesses and consumers. The inflation in the UK remains relatively high compared to other countries, and the labour market is still strong. If wage growth continues to push prices higher, the BoE may feel pressured to keep rates higher for longer to prevent another inflation spike.
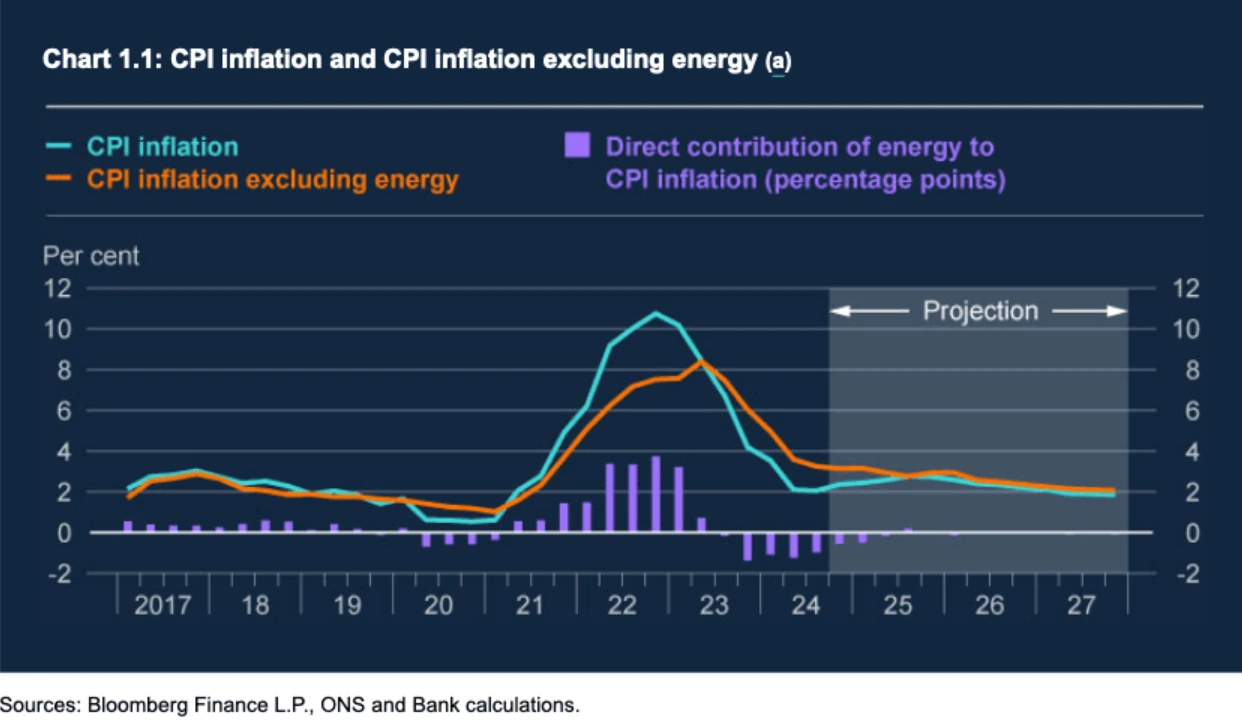
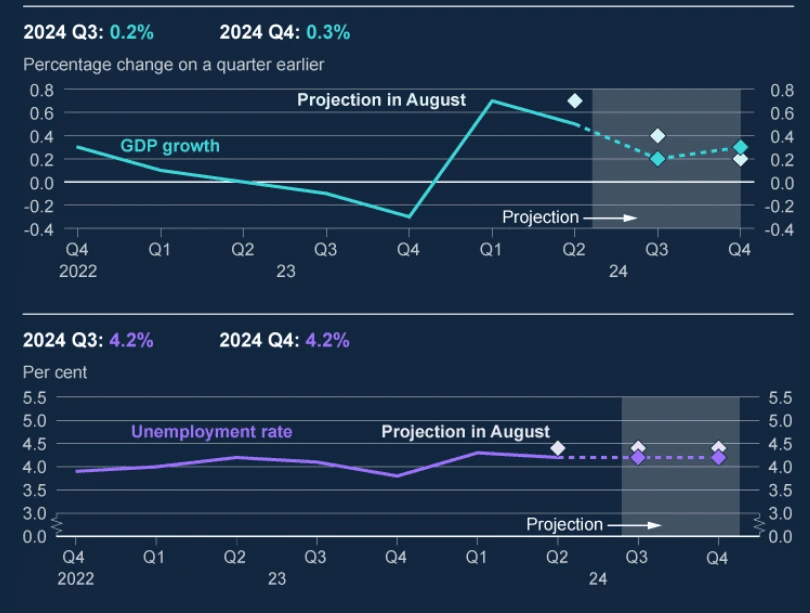
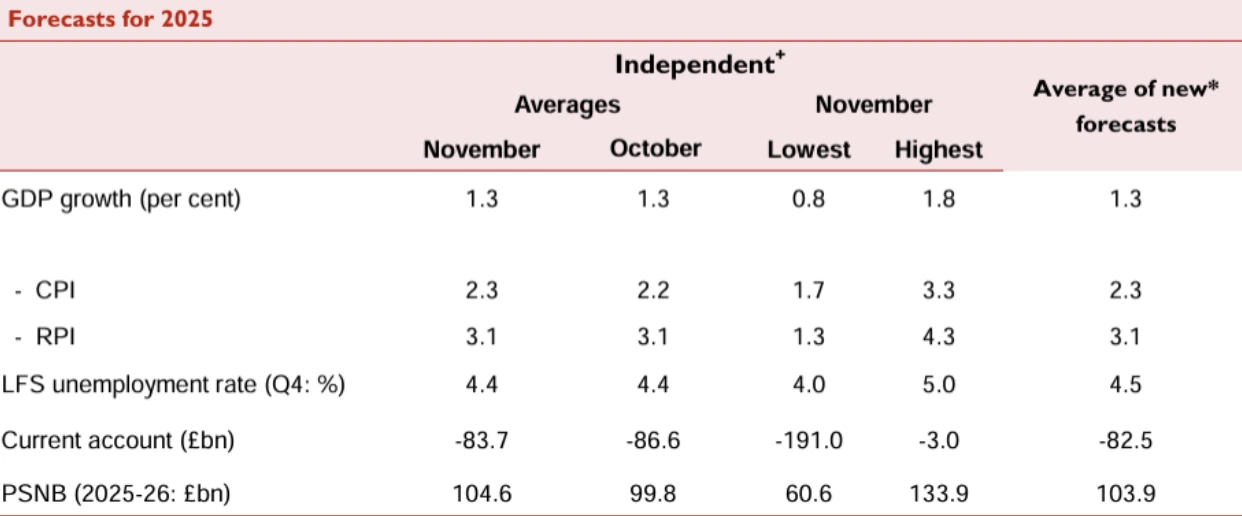
The bank’s latest economic projections predict slower growth and lower inflation in the coming years. GDP growth, which was previously expected to be 1.5% in 2025, is now likely to be revised to 1.0%, following zero growth in the third and fourth quarters of 2024. Inflation is expected to decrease over time, with the inflation rate projected to reach 1.7% by Q1 2027.
Growth and Unemployment Last Forecasts
Market Expectations from Thursday’s BoE Meeting
There are layers of uncertainty around the GBP/USD exchange rate, as the pair has recovered slightly with a weaker dollar, but it remains unstable. A Dovish policy from BoE—before the US Federal Reserve—could push the GBP down again.
If the Bank of England cuts rates on February 6 and marks a shift towards more aggressive easing to counteract the stagnating UK economy, it could be forced into abandoning the interest rate-cutting cycle as soon as the second half of 2025 as inflation risks grow.
UK CPI Forecasts for 2025
The more dovish the outcome, the more the GBP could fall. A rate cut would make borrowing cheaper but could weaken the pound. The opposite scenario is also valid. If the BoE holds rates steady or signals a slower pace of cuts, the GBP might gain strength.
Technical Analysis
From a technical outlook, the GBP/USD is struggling to break above the key resistance near $1.2600. If the BoE cuts rates as expected, we could see the pair resuming a bearish trend towards the $1.2280 level.
Image Source: TradingView | For Illustrative Purposes Only
Overall, the outlook remains uncertain. For now, the market should look for the BoE’s next move today, and much will depend on inflation data, wage growth, and global market trends later this year.
Bank of Japan’s Rate Hike Anticipation: A Turning Point for Markets?
Tomorrow’s rate hike by the BOJ could solidify its shift towards monetary policy normalisation. Japan’s near-zero interest rates have shaped global financial strategies for decades. However, rising inflation and changing economic conditions are driving the need for a new approach.
Fundamental Outlook
The Bank of Japan (BOJ) has again captured market attention as it gears up for its first interest-rate decision of 2025. Following a surprising rate hike in 2024—for the first time in years—the BOJ is widely expected to raise rates again by 25 bps on Friday, January 24, potentially signalling a major shift in Japan’s economic and monetary strategy.
The BOJ’s anticipated move will most likely raise Japan’s interest rates to their highest level in 17 years, breaking away from the ultra-loose monetary policy that has defined the central bank’s approach for decades. Here’s an overview of the decision and its potential market impact.
Japan has long stood out among major economies for its near-zero interest rates, a strategy aimed at combating deflation and spurring economic growth. However, inflation has consistently exceeded the BOJ’s 2% target since 2022, gradually prompting the central bank to unwind its accommodative stance. The 2024 rate hike marked a significant milestone, and markets are pricing in a 92% probability of another increase in 2025.
This decision is closely watched because it offers insight into how Japan plans to tackle inflation without hurting its economic recovery. Policymakers face a tough challenge: raising rates enough to manage inflation while avoiding harm to Japan’s fragile recovery.
What to Watch for in the Decision
The central bank may take a cautious approach to avoid rattling markets. Key implications of a potential rate hike include:
Strengthening the Yen: Higher interest rates typically attract foreign investors seeking better returns, which could bolster the yen. However, Rabobank analysts caution that the yen’s gains might remain limited unless the BOJ signals a more aggressive stance on future rate increases.
Pressure on Exporters: A stronger yen makes Japanese goods more expensive in international markets, potentially hurting the country’s export-driven economy. Additionally, Donald Trump’s presidential tariffs could significantly impact Japanese exports, and sectors like automotive and electronics could face challenges.
Impact on Bonds and Investments: Japan’s prolonged low-rate environment has been a cornerstone of global investment strategies. A shift to higher rates could disrupt these dynamics, possibly tightening global liquidity.
Long-Term Market Implications
While some argue that the BOJ’s decision is already priced into markets, the broader implications could reshape investor strategies for years. OCBC analysts suggest that the impact on USD/JPY exchange rates may already be reflected in current valuations. However, the BOJ’s forward guidance will be key to determining how markets react. If the central bank signals a series of rate hikes for 2025, it could lead to:
Further Yen Strength: A more hawkish tone from the BOJ could make the yen more appealing, potentially reversing its recent underperformance.
Global Investment Adjustments: Investors accustomed to Japan’s cheap funding environment may need to rethink their strategies, with ripple effects across global equity and bond markets.
A New Era for Japan’s Monetary Policy
The future trajectory of Japan’s economy and its influence on global markets relies on the BOJ’s ability to balance higher rates with the risk of slowing growth. Investors should brace for potential market turbulence, as this decision could start a new chapter in Japan’s economic strategy.
Technical Outlook
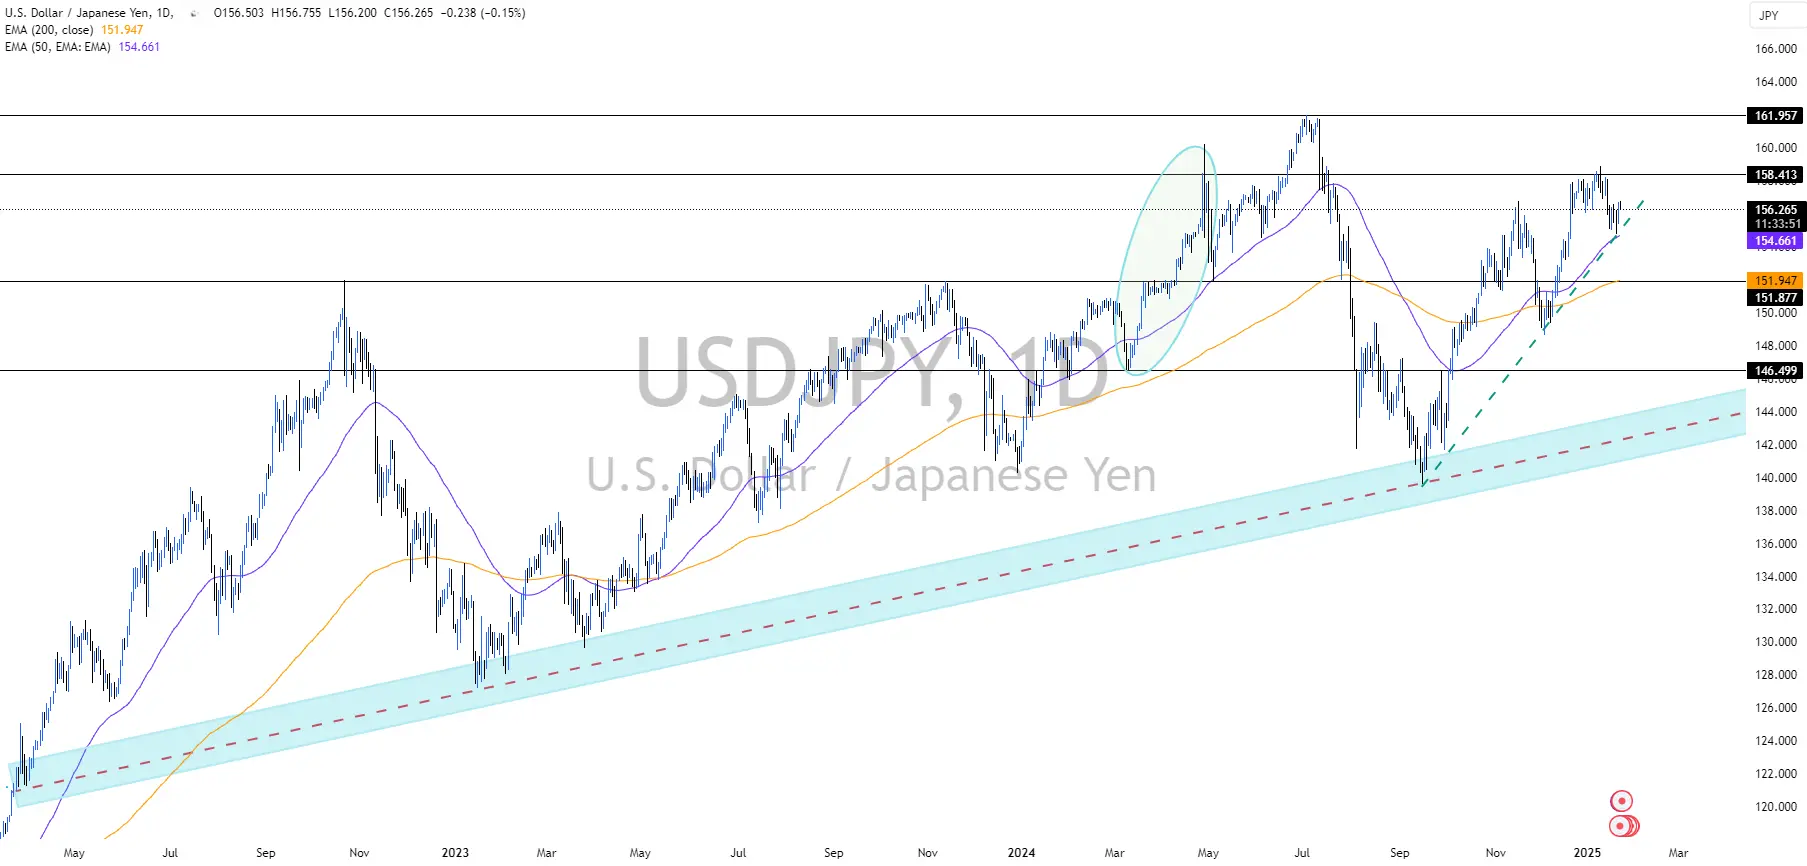
From a technical standpoint, USD/JPY holds well above EMA-50 and EMA-200. It has seen bullish momentum recently, driven by the Fed’s neutral stance on interest rates (4.25%-4.5%) and uncertainty under the Trump administration, fuelling demand for the US dollar. However, the BOJ’s expected rate hike from 0.25% to 0.5% leads to a short-term bearish correction.
Image Source: TradingView | For Illustrative Purposes Only
Key levels to watch are $151.88 and $146.5 for support. A more hawkish BOJ stance could drive further yen strength, while dovish signals would likely push the price to resume its bullish trend.
Global Financial Market Trends Shaping the World in 2024
This year has seen major shifts in global financial market trends. These have been highlighted by sustainability investing, digital transformation, and more.
Key Takeaways
Sustainable and responsible investments continue to grow due to increased demand for ESG-focused financial products and ESG reporting regulatory compliance.
Digital transformation through AI and fintech will promote wider market accessibility and improved customer experiences in financial markets.
Regulatory developments seek to improve investor protection and market stability, shaping global financial market trends.
The global financial market underwent major changes in 2024. These changes were inspired by economic shifts, investor preferences, and regulatory demands. This article analyses the latest trends in financial markets and how they impact investment strategies, market dynamics, and economic growth.
Sustainable and Responsible Investing
It is no surprise that sustainable and responsible investing (SRI) has grown rapidly in the past few years, with investors increasingly focused on environmental, social, and governance (ESG) criteria. This trend is set to accelerate in 2025, enabled by the realisation of global climate change, social inequalities, and corporate governance issues.
Why It Matters?
Investor Demand: With increasing demand, there is an increasing need for investments that reflect ethical values. Investors now seek financial products that generate profits alongside having a positive impact on the environment.
Corporate Accountability: ESG factors make companies prioritising ESG factors more likely to adapt to regulatory changes, mitigate risks, and meet consumer expectations, ultimately benefitting in the long run.
The Impact on Financial Markets
Green Bonds and Investments: In 2025, demand for green and sustainable investments will continue to soar as institutional investors favour green bonds, a new tool financing environmental-friendly projects.
ESG Reporting Standards: To ensure their investments remain transparent and accountable, regulators worldwide require clearer ESG reporting standards. This will result in more standardised ESG metrics, allowing investors to evaluate and compare companies more easily.
Fintech and Digital Transformation
Digital transformation is constantly reshaping global financial markets. The nature of financial services is changing as fintech innovations make them more customer‐centric and accessible. The increased use of technologies like Artificial Intelligence (AI) and Machine Learning (ML) will be the trend of digitising business processes in 2025.
AI and ML Applications: Artificial Intelligence (AI) and Machine Learning (ML) have the potential to enhance decision-making, risk management, and customer service in modern financial systems. For example, AI-powered chatbots enable a better customer experience, whilst ML algorithms improve fraud detection and credit scoring.
Implications for Global Financial Markets
Efficiency and Accessibility: The area where fintech innovations have had a major impact is increasing the efficiency of financial markets and speeding up processes.
Regulatory Challenges: Fintech also has challenges centred around data privacy and cybersecurity. Finding a balance between innovation and consumer protection is crucial for fintech’s widespread adoption.
Market Volatility Due to Geopolitical Tensions
Geopolitical tensions have been a major factor in 2024. The Russia-Ukraine war, US-China trade relations, and political instability in the Middle East have impacted recent trends in financial markets.
The Impact
Increased Volatility: Geopolitical events have caused sudden price shifts in different stages of oil, gold, and natural gas assets. For example, tensions in the Middle East or sanctions against Russia have caused sudden spikes in global oil prices.
Hedging and Diversification: Investors manage geopolitical risks through hedging strategies and a diversifying portfolio. During such times, gold and US Treasury bonds have been profitable investments.
Volatility Strategies
Diversification: Geopolitical uncertainties can be mitigated by diversifying investments in other asset classes and regions.
Investing in Safe-Haven Assets: During volatile times, gold and/or government bonds are some of the best options to safeguard your portfolios.
Inflation and Adjustments of Interest Rates
In 2024, inflation and financial policy adjustments were the main determinants of global financial market trends. Central banks worldwide have strived to manage inflation while trying to develop their economies.
Key Factors to Watch
Interest Rates: Central banks like the US Federal Reserve and the European Central Bank are likely to keep higher interest rates to combat inflation. A ‘higher-for-longer’ strategy means higher borrowing costs and increased investment flows, which can impact asset prices.
Impact on Investment Strategies: A high interest rate tends to perform well in certain sectors, moving trends towards utilities, consumer goods, and healthcare. These sectors have provided stable returns to investors and will likely continue to do so in the following years.
Financial Markets Implications
Cost of Borrowing: Borrowing or taking loans are more costly when interest rates are higher, slowing investment and economic growth.
Currency Fluctuations: Currency values are dictated by changes in interest rates. For example, if the US Federal Reserve continues to hold high rates, the US dollar may strengthen against other currencies.
Integrating Technology in Financial Services
In 2024, the global financial markets made significant progress in integrating with advanced technologies, including the Internet of Things (IoT), 5G, and quantum computing.
IoT in Finance: IoT enables real-time data collection, enabling better risk assessment and fraud detection. For instance, insurance providers can use the data from IoT to analyse risks and create customer-specific policies.
5G Connectivity: With 5G, transactions become faster and more reliable, advancing financial services.
Quantum Computing has the potential to revolutionise financial modelling and security through unimaginable computing speeds and technology.
Benefits and Risks
Improved Efficiency: These technologies improve operational efficiency and customer experience. For example, banks use AI to automate compliance checks, eliminating the need to manually conduct expensive and time-consuming processes.
Data Privacy Concerns: As the use of technology in financial services grows, there are concerns about data privacy and cybersecurity. Hence, ensuring each financial institution applies robust security standards will be essential.
Trade Securely at BitDelta Pro
By trading with BitDelta Pro, you join a user-friendly platform that makes trading simple and meaningful. Through BitDelta Pro, you can trade various assets, such as forex, stocks, equities, and more, allowing you to diversify your investment portfolios.
With our MT5-integrated advanced tools, you can make informed decisions quickly, whilst our secure platform protects your trading and personal data. BitDelta Pro is an ideal place to start, whether you are a beginner or an experienced trader. You can also utilise our copy-trading feature to mimic the trades of master traders within a few clicks and earn profits.
Final Words
Economic, technological, and geopolitical factors have made a major impact on the global financial market trends in 2024. However, key trends have driven market trends, including sustainable investing, digital transformation, geopolitical risks, inflation, and technological integration. To succeed in this ever-changing environment, investors must know, adapt, and be ready to utilise the latest trends in financial markets.
Nvidia, the central chip manufacturer in the AI sector, recently reported impressive quarterly results, though its guidance fell slightly short of high-end analysts’ expectations. The company achieved revenue of $35.1 billion, marking a remarkable 94% year-over-year increase, fuelled by the exceptional performance of its data centre segment. This result exceeded projections of $33 billion, while Nvidia also delivered an adjusted EPS of $0.81, surpassing the forecast of $0.74.
However, Nvidia’s Q4 guidance disappointed some investors. The company projected revenue of $37.5 billion, slightly above the consensus estimate of $37.1 billion but significantly below the most optimistic forecasts of $41 billion. This tempered expectations about the pace of Nvidia’s rapid growth, which has been fuelled by surging AI adoption.
Nvidia’s AI Future: Blackwell Chips
CEO Jensen Huang highlighted the transformative potential of AI and robotics, emphasising their ability to drive innovation across industries and nations. He announced that Nvidia’s next-generation Blackwell chips are now in full production, though demand is expected to exceed supply for several quarters.
While Nvidia remains a leader in the AI and GPU markets, it faces challenges in scaling production to meet growing demand. Additionally, investors are concerned about the company’s reliance on a small group of cloud providers, including Microsoft and AWS, which now account for 50% of its data centre revenue, up from 45%.
Despite these challenges, Nvidia remains optimistic about its role in the AI and semiconductor markets. Strong demand for its AI-accelerating chips continues to support its growth strategy, positioning the company well for long-term success.
Technical Analysis
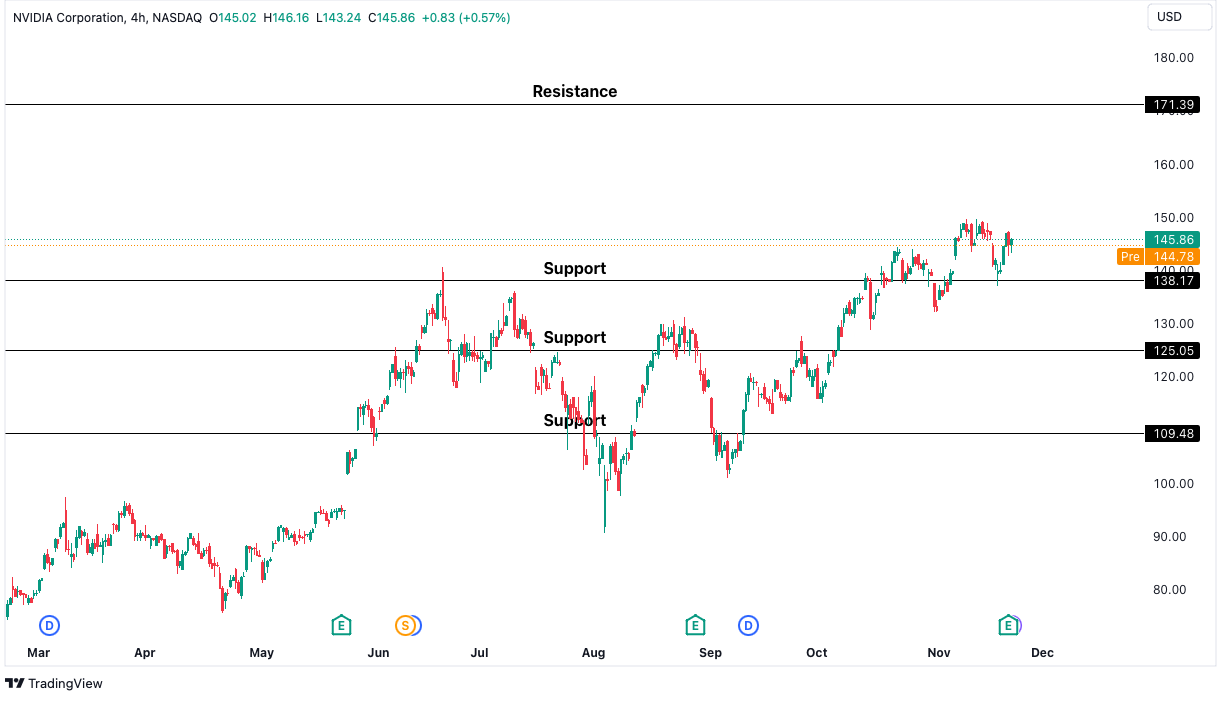
Image Source: TradingView
Nvidia remains a strong contender in the AI-driven market, with significant upside potential despite facing certain challenges. From a technical standpoint, the stock maintains a well-defined upward trend, making it an attractive option for long-term investors. Key support levels are identified at $138.17 (S1), $125.05 (S2), and $109.48 (S3), offering strategic entry points for accumulation.
Resilience Despite Mixed Revenue Guidance
The outlook suggests a high probability of the stock achieving a new all-time high. A confirmed breakout above $150 could signal further bullish momentum, with the next resistance level at $171.39 as the target. Investors may consider utilising pullbacks as opportunities to strengthen their positions while the stock advances.
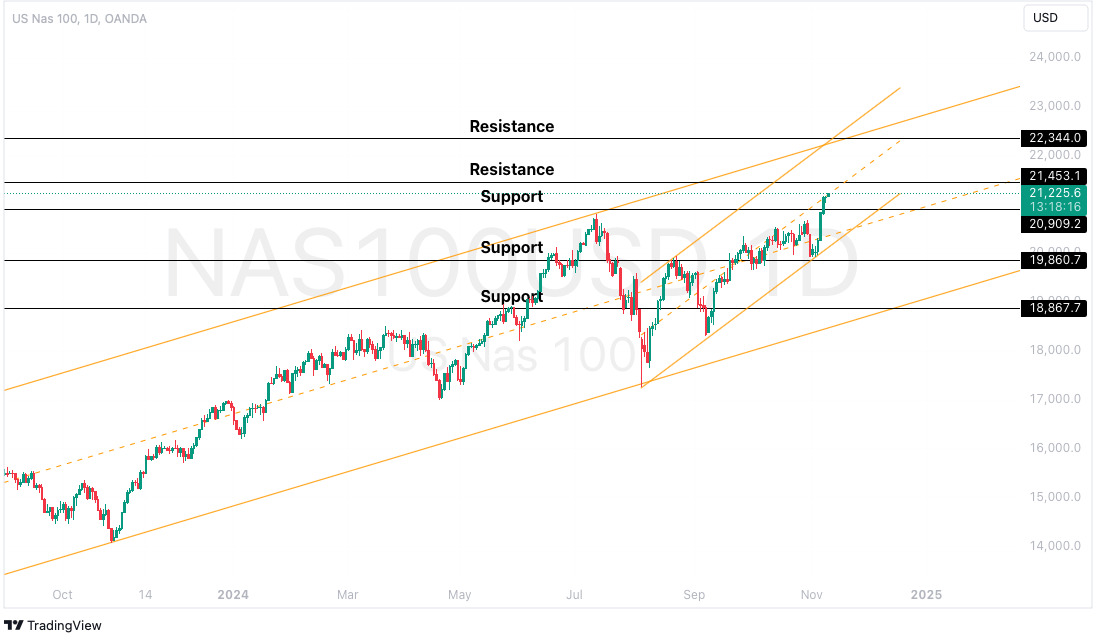
Post-Election Rally Boosts Market, But Volatility Fears Remain
The stock market cooled off this past week after its strong post-election performance. The major indices all ended lower – the S&P 500 fell 2.30%, the Dow Jones dropped 1.39%, and the tech benchmark Nasdaq Composite, declined the most at 3.49%. Despite this recent dip, the S&P 500 is still having an impressive year, up more than 26% since January and holding onto a 1.5% gain since the election.
Seasonal Strength in S&P 500
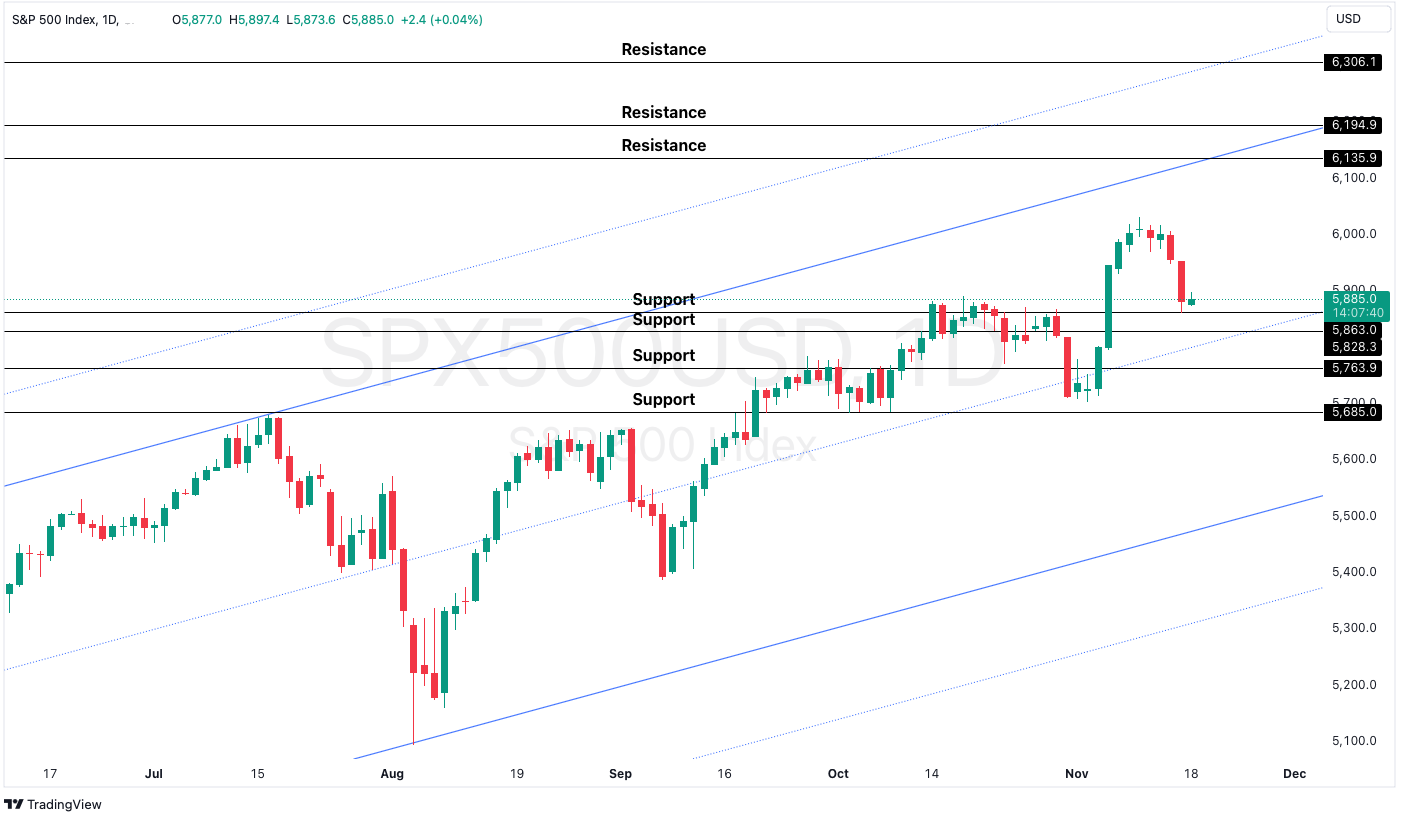
The overall outlook for the S&P 500 index remains positive. Fundamentally, the latest inflation report from October came in as expected, indicating a continued downward trend in inflation. However, some areas are still seeing more persistent price pressure, particularly in housing costs, rent, and car insurance. Despite this, market sentiment suggests inflation will gradually approach the Federal Reserve’s goal of 2%, with the potential to settle between 2-3% in the longer run.
The market has entered a seasonally strong period, with November and December historically delivering positive stock performance, particularly in presidential election years. This year’s post-election rally has already significantly boosted the market performance. While continued momentum is possible, supported by corporate earnings growth, persistent policy uncertainty is expected to weigh on markets. The overall bull market appears healthy, but expect some bumpy rides along the way.
Technical Analysis
Image Source: TradingView
The S&P 500 remains in a strong uptrend, with the current pullback viewed as a consolidation before the next leg higher. Should today’s closing price maintain above the support level at $5,863, the index could target the next resistance at $6,135.90. A failure to hold this support would suggest a potential move towards the next lower support level. Overall, market sentiment remains bullish, suggesting that accumulating near-support levels offers a more favorable position for future buying opportunities.
How to Analyse Market Trends Using Data: Insights & Strategies
Learning how to analyse market trends using data helps spot potential opportunities and make better trading decisions. This article discusses how you can do so.
Key Takeaways
Understanding data types is essential: Different kinds of data – such as historical price data, trading volume, sentiment, technical indicators, and fundamental data – give different insights into how to analyse market trends.
Technical indicators guide trading decisions: Other tools, including moving averages, RSI, and Bollinger Bands, help traders observe areas of possible entry and exit, depending on the market trends.
Market sentiment is a key factor: Sentiment from sources such as news and social media can give insights into market psychology, which affects price movements.
Testing and validating strategies reduce risks: Always test your insights with demo accounts or small sums to avoid potential losses.
‘Knowledge is power’ is a statement that is particularly true in the world of trading. Buying and selling assets can be stressful and hardly predictable, and traders need real-time data insights and market trend research to make informed decisions. But what are market trends?
Using data from market trend research can improve your trading strategy. It helps you identify patterns, understand market movement, and and predict future price movements. In this guide, we will help you get started with using data to perform market trend research in trading.
What are Market Trends, and Why Data Matters in Trading?
In trading, data helps you detect market trends, observe price shifts, and potentially predict how markets will turn out. By analysing the data, traders can better comprehend trends and make decisions that are not simply based on assumptions but on facts. Making informed decisions helps reduce risk, better manage asset allocation, and explore profitable opportunities.
Key Data Metrics for Market Trend Research
Different kinds of data can tell you how the market behaves. Here are the key types and what they indicate:
Historical Price Data: This includes previous asset prices, trading volumes, and price movements. Historical data allows traders to better grasp past market behaviour, explore existing trends, predict the behaviour of price patterns, and more.
Trading Volume: Shows the quantity of any asset traded over a certain period. High trading volumes often signal that many traders are interested in a market, which can mark the beginning of an upward trend. On the other hand, low volume may indicate market hesitation or a potential trend shift.
Sentiment Data: Market sentiment data is about what traders think about a particular asset. Traders can get a sense of the market’s mood by analysing news articles, social media trends, and discussions on trading forums, as these influence the price movement.
Technical Indicators: Moving Averages, Relative Strength Indexes (RSI), and Bollinger Bands derive from price and volume data. They give practical insight into price trends to help traders decide when to enter and exit a trade.
Fundamental Data: Fundamental data focuses on economic activity and how this drives asset prices in the context of company earnings, economic reports, and world events. For example, currency and stock markets may be affected by interest rate changes or economic growth projections.
How to Analyse Market Trends in Trading Using Data?
After understanding market trends and the available data types, we will explore how to use them effectively in trading.
Define Your Goal
Your first duty will be to set specific goals. Do you want to predict short-term movements or a long-term trend? Having clear goals reduces the madness of deciding what data to examine and helps focus the analysis.
Collect Reliable Data
For accurate analysis, you need reliable data. For trading, common data sources include:
Market Data Providers: Live market data and historical price charts are available on Bloomberg, Reuters, and TradingView.
Brokerage Platforms: A trading platform like BitDelta Pro offers live data, technical indicators, and news articles.
Economic Calendars: Economic events and announcements can influence market trends; BitDelta.pro offers an economic calendar that updates in real-time.
Using more than one source can lower the risk of making decisions based on partial information.
Organise Your Data
Clean your data before analysis to eliminate errors. When validating data, check for missing price data points or inconsistencies in trading volumes. Properly organising data in spreadsheets or software helps perform analysis easily and accurately.
Search for Price and Volume Patterns
Uptrends, downtrends, or consolidation patterns show the market direction. When you look at the price movements with respect to trading volume, you can understand how strong a trend is. For example:
Uptrend: A rising trend is indicated when we see higher highs and higher lows accompanying increased volume.
Downtrend: A downward trend is indicated if lower lows and lower highs coincide with steady volume.
Consolidation: Sideways moves with low volume often show the market is on the brink of a breakout.
Apply Technical Indicators
Trading uses technical indicators to analyse price trends. Here are some popular ones:
Moving Averages (MA): Moving averages data indicates the direction of a trend. For example, a 50-day MA crossing above a 200-day MA may indicate a bullish trend.
Relative Strength Index (RSI): RSI detects whether an asset is overbought or oversold. An RSI value above 70 generally indicates overbought conditions, and an RSI value below 30 is considered oversold.
Bollinger Bands: These bands use a middle 20-day moving average with upper and lower bands to show price volatility. When prices are close to the upper band, overbought conditions are signalled, whereas when they are close to the lower band, oversold conditions are signalled.
Interpret Market Sentiment
Market sentiment is the mood of traders in the market as a whole. For example, a sudden increase in positive social media posts regarding a stock might mean high demand; if there is negative news surrounding a stock, there might be a sell-off. Traders can use sentiment data to track the market’s perspective and prepare for possible shifts in market trends.
Test and Validate Your Strategy
If you do not perform tests, do not go all-in on a trade based on trend analysis alone; start by testing your strategy on a small scale. For example, if you base your prediction on the uptrend, which means you predict there will be a price rise, try to trade a small amount to check if the prediction is valid. BitDelta Pro also offers a free demo account where you can fake trade without risking real money.
Market Data Analysis Tools in Trading
These three simple, accessible tools make it easier to analyse market data for trading:
TradingView: Traders can use real-time data, technical indicators, and charting tools to analyse price trends and make informed decisions.
MetaTrader (MT4/MT5): MetaTrader is popular with forex and commodities traders and features advanced charting, backtesting, and automated trading tools.
Financial News: Basic stock data, simple free charts, and the latest financial news.
Search Trends on Search Engines: Rising search trends are practical for measuring interest in specific assets or sectors.
Market Analysis in Trading with Real-Life Examples of Using Data
What are market trends all about? Learning how to decode market trends using derivatives data and performing solid stock market trends analysis can help you increase your chances of success in trading. To understand how data-driven trend analysis works, we will look at two practical examples:
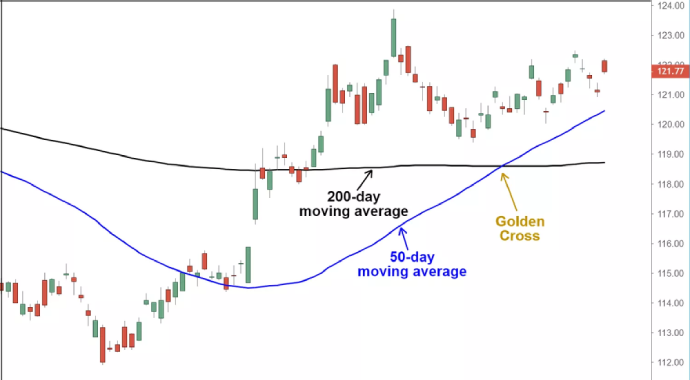
Using Moving Averages (MA) in Stocks
Image Source: TradingView
Stock traders have often used moving averages to determine a currency’s trend. For example, the Golden Cross can be seen if a pair’s 200-day moving average crosses above its 50-day moving average.
Analysing Social Media Sentiment for Stocks
Social media sentiment is a great indicator of stock trading. For example, an increase in positive social media mentions for a company could be a sign of increasing investor interest. During the ‘meme stock’ phenomenon, when social sentiment had a strong bias in moving prices, many traders used this approach to guess which stocks would rise.
Get Started Trading with BitDelta Pro
At BitDelta Pro, we simplify your trading experience with an easy-to-use platform. With our MT5 integration, you can benefit from real-time market data, a massive library of historical databases, and a wide range of advanced trading tools.
At BitDelta Pro, you can trade forex, equities, ETFs, and commodities using a wide range of advanced, fully customisable charting tools, real-time analysis, and indicators. Our platform offers competitive trading fees, leading security protocols, and 24/7 customer support to cater to both experienced traders and beginners.
Bottom Line
Learning what are market trends and how to know market trends using data enables you to make better decisions about where to place your funds for increased chances of making profits. When you define your goals, collect accurate data, use technical indicators, and test strategies, you turn raw potential into promising trades.
It is not only about predicting the next market move but about staying informed and ready for any major potential shifts. Better risk management, opportunity identification, and, most importantly, market trend research and analysis will increase your chances of making profits.
Trump Presidency: Economic and Investment Prospects
With Donald Trump securing another term as president, markets are likely to experience significant shifts in policy and economic strategy. While his administration is expected to drive short-term growth, the long-term impact could bring both opportunities and risks. Here are the key policies to prepare for his presidency and how they would affect the overall market.
Tax Policy: Economic Stimulus or Long-Term Strain?
Trump has signalled intentions to extend the Tax Cuts and Jobs Act (TCJA) of 2017, which reduced income tax rates for individuals and corporations. This extension could sustain lower tax rates and potentially boost corporate profits in the short term. Furthermore, it is anticipated that there will be additional corporate tax reductions and the exclusion of tips and overtime pay from taxation.
Impact: While tax cuts could provide a temporary boost to stock prices, particularly benefiting corporate earnings, the long-term effects remain uncertain. Rising deficits and reduced government revenue, compounded by an ongoing trade war with China, could weigh on the economy over time.
The Trade War with China: Disrupting Global Supply Chains
A cornerstone of Trump’s economic policy is his hardline stance on China. His administration is expected to continue implementing tariffs, possibly up to 60% on Chinese imports. This escalation of the trade war may further strain US-China relations, with China losing access to US markets and seeking alternatives in Southeast Asia. The ‘Tech War’ is also likely to intensify, particularly in semiconductors, quantum computing, and artificial intelligence.
Impact: Tariffs will disrupt US-China trade, potentially benefiting certain sectors in Southeast Asia while contributing to market volatility. The long-term effects on global supply chains could lead to shifts in manufacturing and trade patterns, causing ripple effects across markets.
Healthcare: A Shift in Policy and Impact on Pharma
Trump’s administration will likely focus on repealing and replacing the Affordable Care Act (Obamacare) with a new healthcare plan. Additionally, there is an expectation of an executive order aimed at reducing prescription drug prices under Medicare to make US drug costs more competitive with those in other developed nations.
Impact: While healthcare reforms may reduce government spending, drug price controls could exert pressure on pharmaceutical and biotech stocks. Investors in these sectors should be prepared for potential regulatory challenges as the healthcare landscape evolves.
Immigration: Labour Market Disruptions
Trump’s strict immigration policies include efforts to strengthen border security and significantly reduce the number of unauthorised immigrants. These measures could have a significant impact on industries reliant on low-wage labour, including construction, leisure, and service sectors.
Impact: Reduced labour supply may lead to labour shortages, hindering economic growth and driving up costs in certain industries. This could contribute to deflationary pressures and slow overall economic activity, potentially affecting productivity and GDP.
Energy: Prioritising Traditional Energy Sources
Trump’s energy policy will likely continue to favour traditional energy industries such as oil and nuclear power. Expect expedited approval for oil drilling permits and greater emphasis on natural gas exports. Additionally, Trump is expected to maintain his rejection of global climate change initiatives, including the US’ withdrawal from the Paris Agreement.
Impact: Traditional energy stocks, especially in the oil and nuclear sectors, are expected to benefit under Trump’s policies. Conversely, clean energy stocks could face increased pressure as the administration prioritises fossil fuels over renewable energy.
However, it’s important to note that while Trump’s energy policies may lead to an increase in domestic oil production, this could put downward pressure on oil prices in the long term due to higher supply.
Short-Term Growth, Long-Term Risks
Trump’s economic policies focus on stimulating short-term growth through tax cuts, corporate profit increases, and the expansion of the energy sector.
However, these measures present long-term risks, such as trade disruptions, rising inflation, and potential imbalances in the labour market. The combination of a trade war with China, stringent immigration policies, and aggressive fiscal stimulus could contribute to heightened volatility in global markets.