How to Use Technical Indicators on MT5 for Better Trading?
4 MINS READ
Team BitDelta Pro • 11 Apr 2025
IndicatorsMT5Trading
4 MINS READTeam BitDelta Pro • 11 Apr 2025
Key Highlights
Technical indicators are tools that help traders interpret historical data to predict future price movements, providing structure and clarity in decision-making.
MT5 is a powerful trading platform equipped with 38 built-in technical indicators, offering traders in-depth market analysis capabilities across trend, momentum, volatility, and volume.
Combining indicators wisely (e.g., trend + momentum) and back testing strategies on historical data improves accuracy and reduces false signals.
Avoid common mistakes like relying on a single indicator, overcrowding charts, or ignoring macroeconomic context — a balanced, well-informed approach leads to better trading outcomes.
MetaTrader 5 (MT5) is a high-level trading platform known for its robust analytical tools and intuitive interface. Among its many features, MT5 offers a wide array of technical indicators that are vital for traders aiming to make informed decisions. These indicators assist in analysing market trends, momentum, volatility, and volume, thereby enhancing the precision of trading strategies.
Understanding Technical Indicators in MetaTrader 5
Technical indicators are mathematical calculations based on the price, volume, or open interest of a security. They help traders forecast future price movements by identifying patterns and trends in market data. MetaTrader 5 simplifies the use of these indicators by providing 38 built-in technical indicators and 44 analytical objects, catering to various analytical needs.
These indicators are broadly categorised into:
Trend Indicators: Identify the direction of market movements.
Momentum Indicators: Measure the speed of price changes.
Volatility Indicators: Assess the rate of price fluctuations.
Volume Indicators: Evaluate the strength of a price movement based on trading volume.
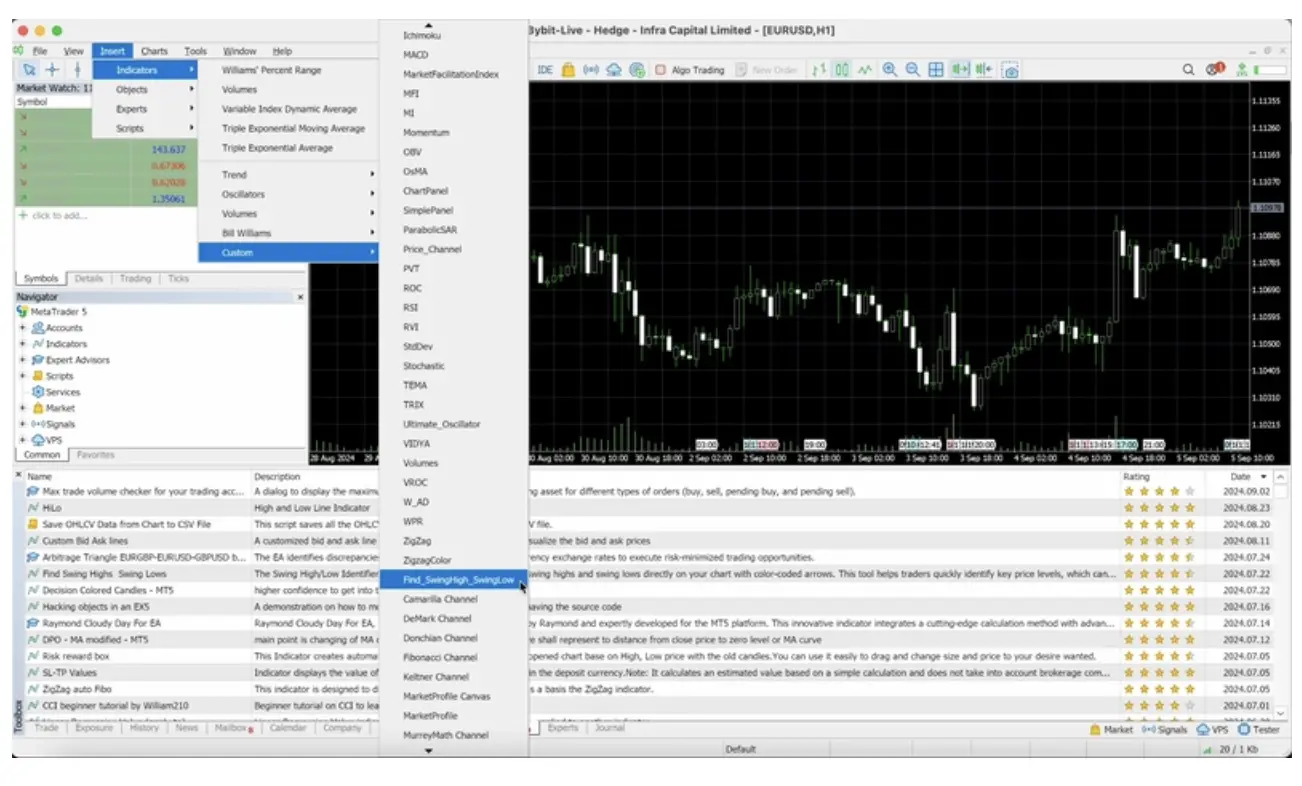
How to Add and Customise Technical Indicators on MetaTrader 5?
Integrating technical indicators into your MT5 platform can be accomplished through the following steps:
Accessing Indicators
Open your MT5 platform.
Navigate to the ‘Insert’ menu.
Select ‘Indicators’ and choose from the list of available indicators.
Customising Indicator Settings
After selecting an indicator, a settings window will appear.
Adjust parameters such as period, colour, and line style to suit your analysis preferences.
Using Multiple Indicators
You can apply multiple indicators to a single chart to gain more comprehensive insights.
Be cautious not to overcrowd the chart, which can lead to analysis paralysis.
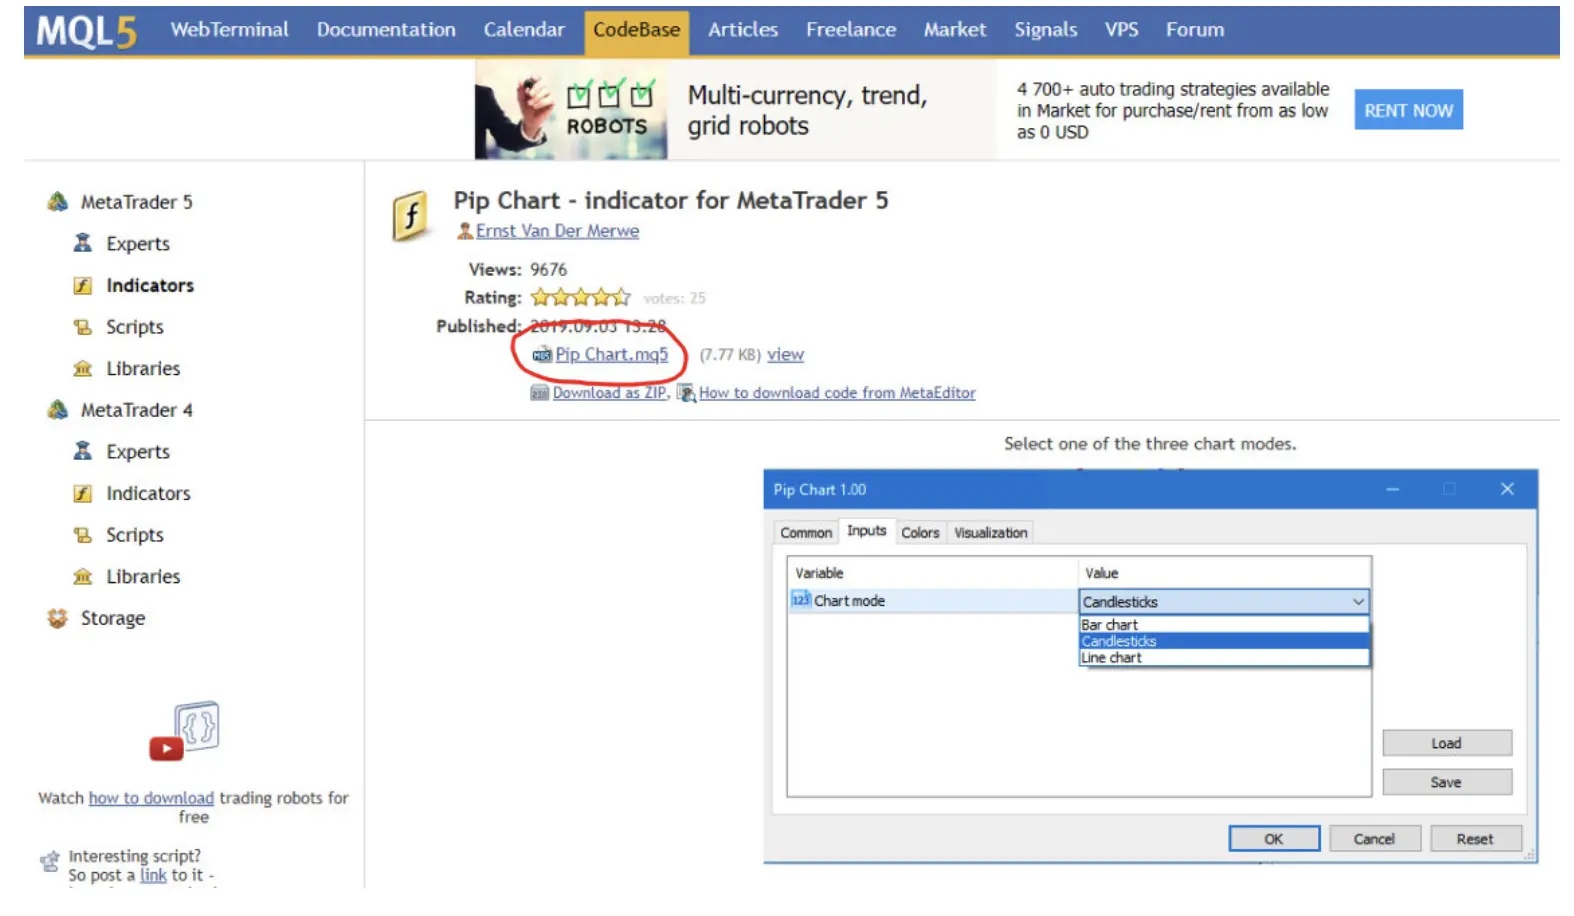
For Traders Interested in Using Custom Indicators
Download the Custom Indicator
Ensure the indicator file is in ‘.ex5’ format.
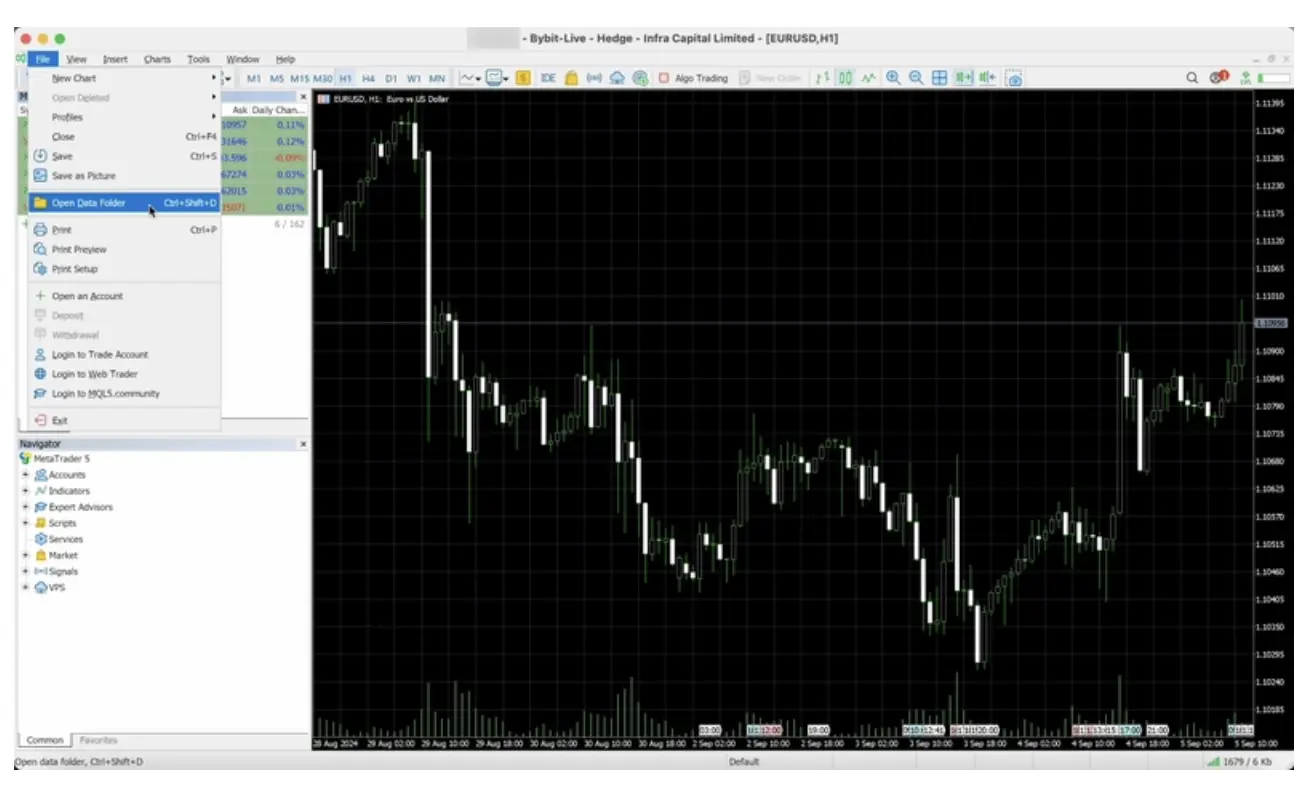
Install the Indicator
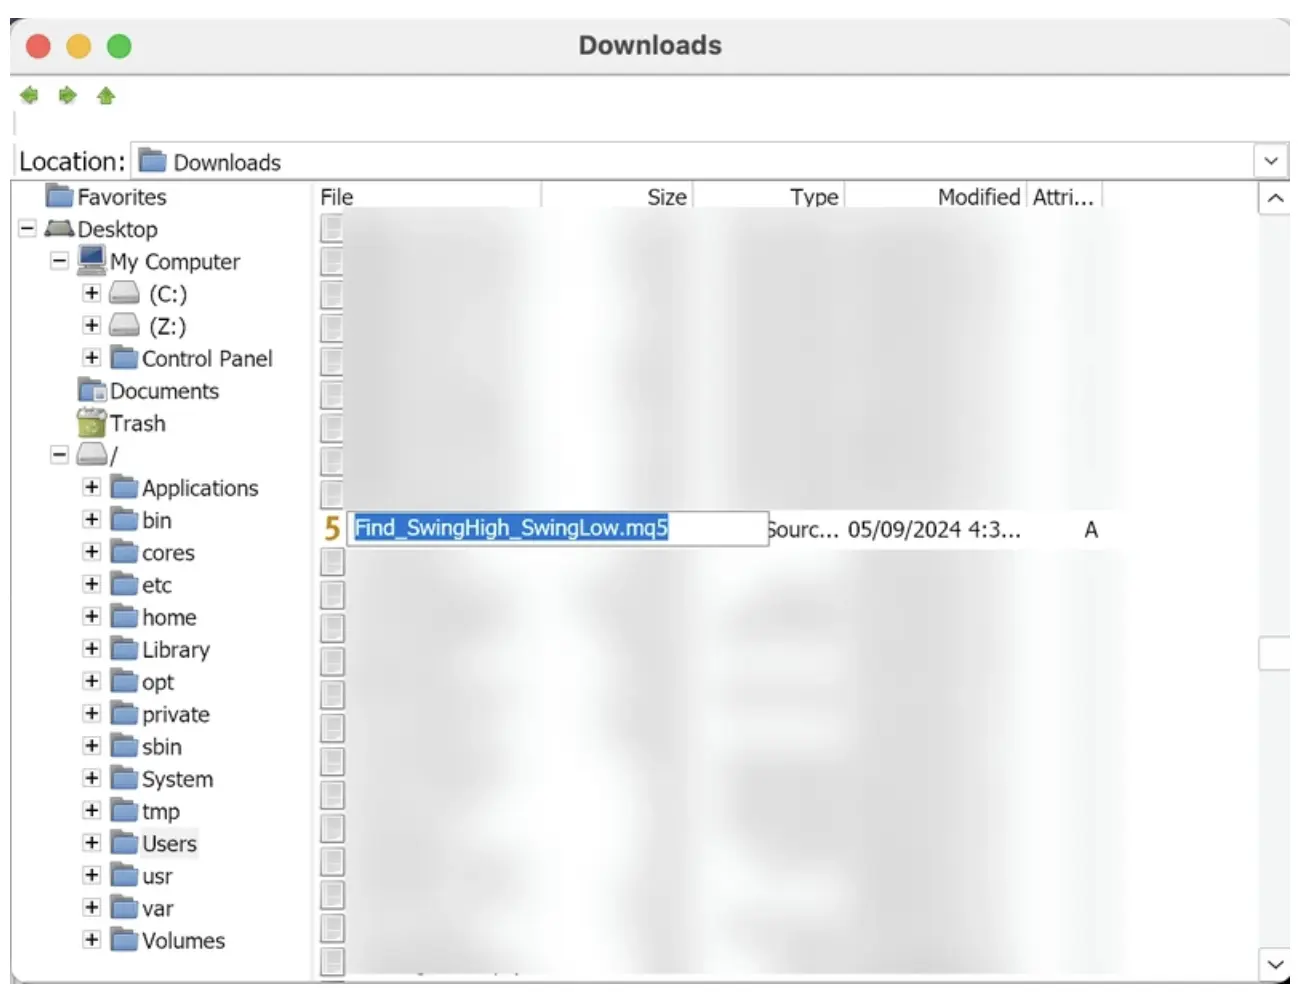
In MT5, go to ‘File’ > ‘Open Data Folder’.
Open the ‘MQL5’ folder, then the ‘Indicators’ folder.
Copy the downloaded ‘.ex5’ file into this folder.
Restart MT5
Close and reopen the platform to enable the new indicator.
Add the Indicator to a Chart
Open the desired chart.
Navigate to ‘Insert’ > ‘Indicators’ > ‘Custom’ and select the installed indicator.
This process allows for the seamless integration of custom indicators tailored to specific trading strategies.
Popular Technical Indicators for Better Trading Decisions
MT5 offers a variety of indicators that cater to different analytical needs:
Trend Indicators
Moving Averages (MA): Smooth out price data to identify the direction of the trend. Variants include Simple Moving Average (SMA) and Exponential Moving Average (EMA).
Bollinger Bands: Consist of a moving average and two standard deviation lines, helping to identify periods of high or low volatility and potential overbought or oversold conditions.
Ichimoku Cloud: Provides information on support and resistance levels, trend direction, and momentum.
Momentum Indicators
Relative Strength Index (RSI): Measures the magnitude of recent price changes to evaluate overbought or oversold conditions on a scale of 0 to 100.
Moving Average Convergence Divergence (MACD): Shows the relationship between two moving averages of a security’s price, aiding in identifying trend direction and momentum.
Stochastic Oscillator: Compares a particular closing price of a security to a range of its prices over a certain period, useful for identifying potential reversal points.
Volatility Indicators
Average True Range (ATR): Measures market volatility by decomposing the entire range of an asset price for that period.
Volume Indicators
On-Balance Volume (OBV): Uses volume flow to predict changes in stock price.
Volume Weighted Average Price (VWAP): Gives the average price a security has traded at throughout the day, based on both volume and price.
Best Practices for Using Technical Indicators on MetaTrader 5
Avoid Over-Reliance on a Single Indicator: Use a combination of indicators to confirm signals and reduce the risk of false positives.
Combine Indicators for Stronger Confirmations: Pairing trend indicators with momentum indicators can provide more robust analysis.
Backtest Strategies Using Historical Data: Evaluate the effectiveness of your strategy by testing it against past market data.
Manage Risk with Stop-Loss and Take-Profit Levels: Implementing these tools can help protect against significant losses and secure profits.
Common Mistakes to Avoid
Misinterpreting Signals Due to Lack of Confirmation: Always cross-check indicator signals with other tools or market factors. A single indicator might show a buy signal, but without supporting data, acting on it could lead to losses.
Using Too Many Indicators: This can lead to ‘analysis paralysis’. Stick to a combination of 2–3 indicators that complement each other and suit your trading style.
Ignoring Fundamental Analysis: While technical indicators and tools are powerful, ignoring macroeconomic news or earnings reports can result in missed context or unexpected price swings.
Your Strategy’s Secret Weapon: Technical Indicators
Technical indicators are essential companions in every trader’s toolbox. Whether you’re trying to catch a trend early, time an entry point, or manage your risk, these tools provide structure and clarity in an otherwise chaotic market.
By learning how to effectively use MT5 indicators and customising them to fit your strategy, you can turn complex market data into actionable insights. Just remember — no tool works in isolation. Success lies in combining the right indicators with solid risk management and market awareness.
Ready to make better trades?
Start exploring technical indicators on MetaTrader 5 with BitDelta Pro today and elevate your trading strategy.
FAQs
Technical indicators are mathematical tools used to analyse past market data like price and volume to potentially predict future market movements.
MT5 comes with 38 built-in technical indicators and also supports custom indicators for more advanced analysis.
Yes, you can download custom MT5 indicators from the MQL5 marketplace or other trusted sources and install them manually.
Moving Averages, RSI, and MACD are commonly recommended for beginners due to their simplicity and reliability.
Yes, but be cautious. Using too many can clutter your charts and confuse your strategy. Stick to a balanced combination.
Look for confirmations from other indicators or tools and always consider the broader market context before acting.
No, most custom indicators are plug-and-play. However, understanding basic functions helps in modifying or creating new ones.
Built-in indicators come with MT5 by default. Custom indicators are created by third parties and offer more specialised functions.
Yes, they’re helpful for day trading, swing trading, and long-term investing — but their usage and settings will vary.
No. They help improve decision-making but should be used alongside sound risk management and a clear strategy.
DISCLAIMER
This communication is for informational and educational purposes only and should not be construed as financial, investment, or legal advice. BitDelta Pro does not guarantee the accuracy, completeness, or timeliness of the information provided. Trading in traditional securities (such as forex currency pairs, stocks, bonds, and commodities) carries inherent risks, including potential loss of principal. Users are encouraged to carefully evaluate their financial objectives, conduct their own research, and seek independent financial advice before making any trading decisions. BitDelta Pro is not liable for any losses or damages resulting from actions taken in response to this communication.
Register an Account
Start your trading journey and explore limitless trading opportunities


;?>)